Every data scientist gets asked the same question sooner or later: “Can you predict it?” For me, that question arrived with Nigeria’s 2027 presidential election. So I did what I would do with any messy forecasting problem. I built a model, broke it on purpose, and wrote down exactly where I trust it and where I am guessing.
Here is the headline. Bola Tinubu is the favourite to win on 16 January. I played the election out 50,000 times using Monte Carlo simulation, and he came out on top in 78 of every 100 runs. Peter Obi won about 12 and Atiku Abubakar about 10.
| 78% | 12% | 10% |
| Tinubu wins, 50,000 simulated elections | Obi wins | Atiku wins |
That is a strong lead. It is not a lock, and the detail matters more than the headline.
The data science bit: how the model works
The idea is simple. For each of the 36 states and the FCT, the model scores Tinubu, Atiku, Obi and a fourth bucket I call Others, which holds Makinde’s APM, the PDP and every smaller party. It scores them with ten factors, adds up the votes, and applies Nigeria’s rule that a winner needs the most votes and at least 25% in 24 states. If nobody manages that, the top two go to a run-off.
The ten factors cover how much the 2023 map repeats itself, where each ticket comes from, how well each ticket fits a state’s faith mix, which governors have moved, how many races each party has candidates in, hardship, insecurity, local kingmakers and the feeling that power should stay in the south. On top of that sit national forces: the pull of incumbency, how people feel about the government’s performance, and the fact that not every APC voter outside the South West is a Tinubu voter this time.
Then comes the part that makes it a forecast and not an opinion. The model does the whole thing 50,000 times, nudging every weight and the national mood a little each time. The answer comes out as a spread of outcomes, not a single number.
“A forecast that gives you one number is hiding something. The honest answer is a range.”
What the votes look like
The starting point is 2023. Tinubu took 36.6%, Atiku 29.1% and Obi 25.4%, with Kwankwaso on 6.4%. Because Kwankwaso is now Obi’s running mate, I added his vote to Obi’s. From there, the model adjusts for everything that has changed.
The typical result is Tinubu 39%, Obi 29%, Atiku 28% and everyone else about 3%. Median turnout is 30%, against about 27% in 2023.
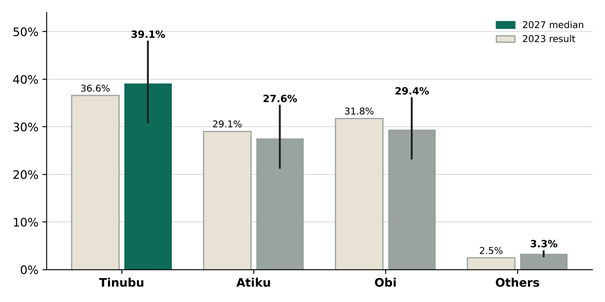
Figure 1. Tinubu leads at a 39% median, but the ranges overlap. The thin line is the 10th to 90th percentile. Base case, 50,000 simulated elections (5 November 2026). 2023 result from INEC, with Kwankwaso added to Obi.
Look at how those ranges overlap. The typical gap between first and second is only about 6 points, and a swing of that size in the national mood is not unusual. That is why 78% is not 95%.
The rule that makes this harder than it looks
To win in round one, a candidate needs the most votes and at least 25% in 24 of the 37 states including the FCT. Tinubu clears that bar in 70% of my simulations. Atiku does it in 5% and Obi in 1%. When nobody does, the top two go to a run-off, and that happens in 31% of runs.
A run-off is a different contest. In the simulated run-offs Tinubu wins 42%, Obi 33% and Atiku 25%. In my model, voters of the knocked-out candidate split by how close they are to each remaining name, and some stay at home. That tends to favour whoever is the alternative to the incumbent.
What decides it: the mood of the country
I ran a test that data scientists call an ablation. Remove one assumption, rerun the whole election, and see how much the answer moves. It tells you what the model is really leaning on.
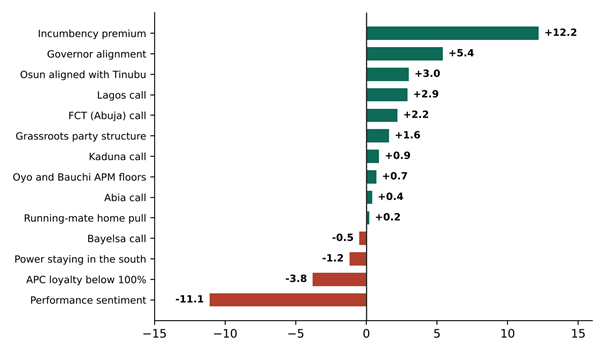
Figure 2. What each assumption is worth, in points of Tinubu’s win chance. Positive helps him, negative hurts him. Base case 78.1%. The five state calls are my own judgement and cannot be back-tested.
Being the sitting president is worth 12 points to Tinubu. The pain of prices, hardship and insecurity costs him 11. They nearly cancel, which is why the answer is so sensitive to anything that moves either one. If the cost-of-living backlash grows, he falls to 59%. If inflation falls and growth reaches households, he rises to 91%.
The part where I show you my own thumb on the scale
A model built on past results cannot see what you know and the data does not. So I overrode it in five places, and I want to be open about it:
- FCT (Abuja): Tinubu is now the favourite. In 2023 Obi took about 63% here, so this goes against the data.
- Lagos: Tinubu is now the favourite. Obi won it narrowly in 2023, 48% to 46%, so this goes against the data too.
- Kaduna: Tinubu gets above 25%, where the model had him on 21%.
- Abia: Tinubu gets above 10%, where the model had him on 3%.
- Bayelsa: Obi gets above 30%, where the model had him on 23%.
Together these add about 7 points to Tinubu’s chance. Lagos is worth 2.9 points and Abuja 2.2, Kaduna 0.9 and Abia 0.4, while Bayelsa takes 0.5 off him. With all five switched off, the model gives Tinubu 71%, Obi 16% and Atiku 12%. I think 78% is my best estimate, but 71% is what the data alone supports, and you should know which is which.
What if I am wrong? Twenty-seven alternative worlds
A single number hides the question people actually argue about: what happens if one of my assumptions is wrong? So I ran 27 alternative worlds, each one a full set of 50,000 elections with a single story changed. Tinubu is still the likeliest winner in 26 of the 27.
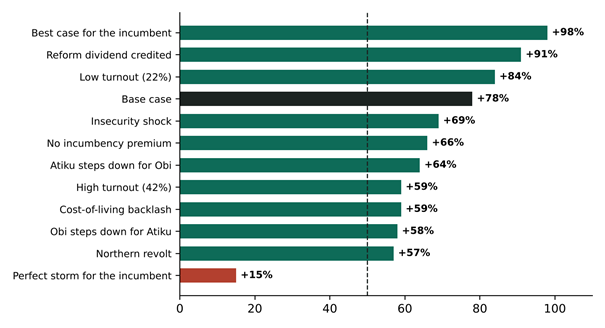
Figure 3. Tinubu’s chance of winning, by scenario. The dashed line marks 50%. A selection of the 27 scenario runs.
The opposition’s choice
If Atiku stands down and backs Obi, Tinubu’s chance drops from 78% to 64%. If Obi stands down for Atiku, Tinubu is at 58%. The opposition does not simply add together: in my model a quarter of the withdrawing candidate’s voters stay at home, and the rest split by how well each remaining ticket fits their state. A united opposition makes this a real contest, but it does not make it a certain loss for Tinubu.
Turnout
High turnout, around 42% against about 27% in 2023, helps Obi most. Tinubu falls to 59% and Obi rises to 34%. Low turnout, around 22%, lifts Tinubu to 85%. Obi’s chances rest on bringing new voters to the polls more than on persuading existing ones.
The perfect storm
Combine a cost-of-living backlash, an insecurity shock, an APC loyalty slump, high turnout and an unfriendly run-off, and Tinubu drops to 15% with Obi at 68%. Combine the best case on prices, turnout, governors and the run-off, and he rises to 98%. I would not put the real chance of either extreme above a few percent, but it shows how much room the range has.
State by state: the 19 places that decide it
Nigerian presidential elections are won state by state. Counting favourites, Tinubu leads in 17 places, Obi in 11 and Atiku in 9. That is a count of favourites, not a forecast of the final tally, because a candidate favoured at 52% loses that state almost half the time. Tinubu is safe in Ondo, Ogun and Ekiti, and Obi in Anambra, Enugu, Imo, Ebonyi and Abia. The rest are battlegrounds.
| State | Favourite | Chance | Typical shares T / A / O |
| Edo | Obi | 64% | 36 / 7 / 51 |
| Benue | Tinubu | 63% | 47 / 13 / 33 |
| Kwara | Tinubu | 62% | 49 / 38 / 7 |
| FCT | Tinubu | 61% | 47 / 12 / 35 |
| Plateau | Obi | 61% | 23 / 27 / 43 |
| Zamfara | Atiku | 60% | 42 / 52 / 2 |
| Kogi | Tinubu | 59% | 45 / 36 / 11 |
| Kaduna | Atiku | 58% | 27 / 42 / 24 |
| Lagos | Tinubu | 57% | 49 / 5 / 40 |
| Borno | Tinubu | 57% | 51 / 44 / 2 |
| Adamawa | Atiku | 57% | 37 / 45 / 12 |
| Cross River | Obi | 54% | 32 / 19 / 40 |
| Taraba | Tinubu | 52% | 39 / 29 / 25 |
| Niger | Atiku | 52% | 38 / 42 / 13 |
| Bauchi | Atiku | 52% | 36 / 38 / 10 |
| Jigawa | Tinubu | 51% | 43 / 41 / 10 |
| Kano | Obi | 51% | 41 / 8 / 43 |
| Bayelsa | Tinubu | 50% | 39 / 20 / 32 |
| Nasarawa | Obi | 44% | 27 / 30 / 35 |
T = Tinubu, A = Atiku, O = Obi. Ranked by the chance that the favourite wins the state. Lagos, Abuja, Kaduna, Abia and Bayelsa include my hand calls.
Kano is a coin flip, with Obi at 51% and Tinubu at 47%. It has the biggest register in the North, and Kwankwaso’s base now sits on the Obi ticket. Rivers is at 79% for Tinubu, with a typical 62% against 47% in 2023. That is the Wike factor. Osun moved to the APC column because the governor is now aligned, and if that fails, Tinubu’s overall chance falls to 75%.
A warning from 2023: why I do not trust polls blindly
The obvious comparison is with polls, and the 2023 record is a caution to everyone, me included.
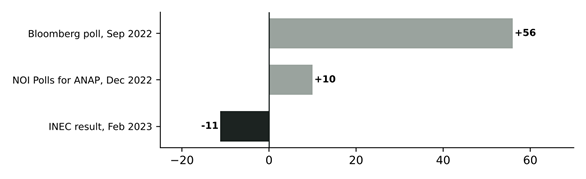
Figure 4. Obi’s lead over Tinubu, in points. Positive means Obi ahead. Sources: Bloomberg poll via StatiSense on X; NOI Polls for ANAP via Vanguard (Dec 2022); INEC declared result.
Bloomberg’s September 2022 poll had Obi on 72% to Tinubu’s 16%. NOI Polls had Obi on 23% and Tinubu on 13%, with a large share undecided. INEC declared Tinubu 36.6% and Obi 25.4%. On the gap between the two, the polls missed by 67 and 21 points. My reading is that polls built on self-selected or phone samples tend to overstate whoever is loudest online, and that undecided voters decide elections.
Today’s polls have the same weakness. The Oxford-Metro online poll puts Tinubu on 35.4%, Obi on 33.9% and Atiku on 26.7%, which is close to my shares. But Lagos and the FCT supply 54% of its 69,110 answers, so I would not treat it as a benchmark. PIG’s early forecast gives Tinubu 20 states, Atiku 9 and Obi 8 plus the FCT, with no shares, no probabilities and no stated method.
How good is this, really?
I would be uncomfortable if you took the 78% at face value, so here is what I can and cannot show.
What I could test
I back-tested the factors that history can speak to: how much the previous geography repeats, where the presidential candidate comes from, and the faith fit of the ticket. The test hid one geopolitical zone at a time, fitted the weights on the rest, and asked the model to call every state in the hidden zone, across the 2019 and 2023 elections. That makes 74 state calls. The model picked the right winner 48 times (65%). A baseline with none of the factors switched on got 22 (30%).
So for the part of the model that rests on history, I am reasonably comfortable. Calling a state is far easier than forecasting a national share, though, and 65% is a decent score, not a great one.
What I could not test
Governor alignment, grassroots structure, incumbency, performance sentiment, APC loyalty, running-mate home states and the rotation effect are judgement calls, and so are my five state calls. There are too few Nigerian elections since 1999 to separate those effects. They are also where almost all of the movement in my answer comes from. That is why I keep showing you the lower numbers: 75% with only the back-tested factors, and 71% with my five calls removed. If I have a bias, it leans slightly towards the incumbent.
What my stroke model taught me
My main modelling project before this one was stroke prediction, from my MSc. I trained several models on 5,110 patient records, and the best one, XGBoost, reached 90.73% accuracy. That sounds impressive. But only about 5% of those patients had a stroke, so a model that never predicted a stroke at all would have scored about 95%.
I took two lessons from that. Accuracy alone flatters a model on lopsided data, and you have to look at what the model gets wrong, not only what it gets right. That is why this post is full of ranges, scenarios and the numbers without my own calls.
What the model cannot see
Anything that happens before 16 January, such as a candidate stepping aside, a defection or a court ruling. How the vote is run: logistics, vote buying and intimidation are not in the model. Late deciders. Errors that move together across a region. And anything after one run-off. Seven or eight in ten is a strong favourite, not a certainty, and a one in nine chance for Obi is not a freak outcome. Nothing here is an endorsement of any candidate or party.
About the author
| I am Olaniyi Oluseyi Gideon, a data scientist based in UK and the founder of Nygon Technologies a company that focuses of Data Science, AI and Software development. I hold an MSc in Data Science from the University of Wolverhampton. I’m also a certified AgilePM Practitioner and a member of APM. I came to this as someone who builds predictive models, and I tried to treat an election the way I would treat any other forecasting problem. I would welcome corrections, especially from people who know particular states, parties or polling methods better than I do. Contact: realoluseyi@gmail.com |